How to measure Engineering Productivity?
The fact that you clicked on this article tells me that you are leading/heading a Team, group or an entire Engineering function and most likely a fast-paced startup. Assume the following,
It was a regular weekday, and your CEO/CTO asked the most intriguing question.
Do we measure Engineering Productivity? How do we fare? What can we do to improve it?
Well, if your boss’s name is not Elon Musk or if you do not work for Twitter, you can still be saved. Go on and read through. I know it is a long read.
What is Engineering Productivity?
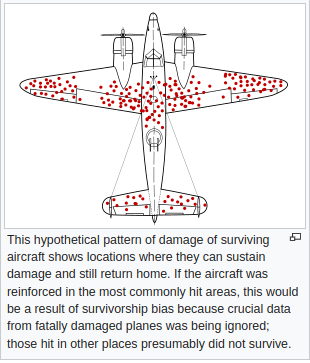
As with anything you’re trying to improve, it starts with measuring the right data. So, you can actually track the right metrics. This data will form the basis of your analysis and baseline. I strongly recommend you don’t change anything about your current engineering process before you can collect sex weeks’ worth of data about your processes. If you start working on processes, you could end up with a Survivorship Basis.
You should have sufficient historical data to make comparisons. On top of that, most teams work in sprints of two weeks, so six weeks of data allows you to collect data for at least three different sprints. This will give you the allowances for any spikes and eliminate any unusual stress or slack on the execution.
Next, you should make gradual changes to the engineering process to see what improves or impedes the value delivery. It’s ideal to only implement one change at a time, so you can see the effect of each change, with all other things being equal. (it never is :D)
For example, if your engineering squads suffer from significant technical debt, you may want to build an additional stub related to feature completion. Every time an engineer completes a new feature, they must document the new feature. This could mean describing the feature, how is it built, what are the outcomes, how it interacts with other functions and the reasoning behind the design decisions.
By continuously measuring engineering productivity metrics, you can determine if this change has positively impacted the developers’ productivity.
How Is Engineering Productivity Measured?
There are potentially 100s of metrics you can measure for an Engineering Org. Here are four key metrics that will help you to get started with measuring engineering productivity. And I have consciously excluded the Sprint Velocity.
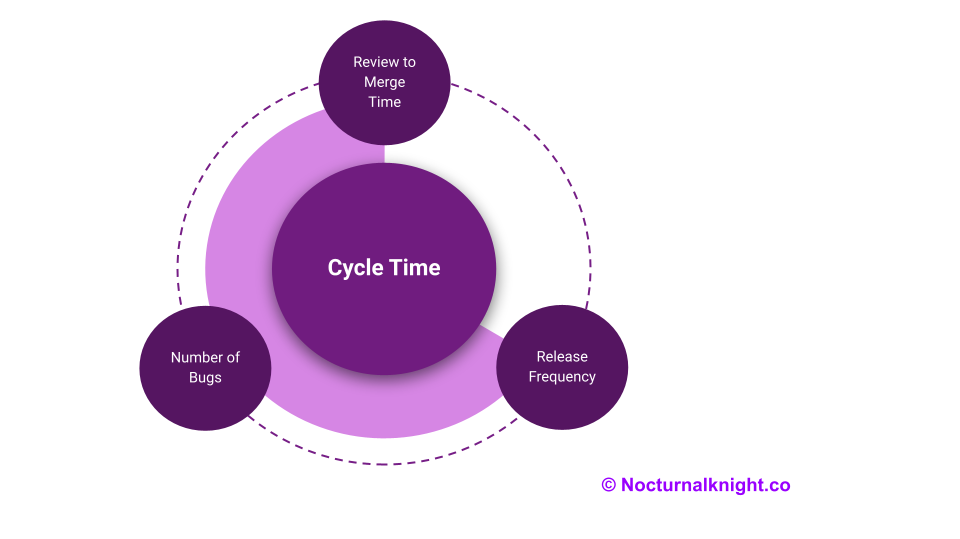
1. The One Metrics to rule them all metrics – Cycle Time
Software development cycle time measures the amount of time from work started to work delivered. It is a metric “borrowed” from lean manufacturing, and it is one of the most important metrics for software development teams. In plain speak, cycle time measures the amount of time from the first commit to production release.
2. The Oracle of an Engineering Leader – Release Frequency
You should measure how often you deploy new changes to your customers (production). In addition, you can track deployments to various branches/instances, such as feature branches, hotfix branches, or QA branches. This data would show you how long it takes for a feature/fix to move through the different development stages. In addition, the Release Frequency reflects the throughput of your team. It’s a good stand-in replacement for Agile Velocity, so you don’t spook your Engineers and you are not blind as well.
3. The Guardrail – Number of Bugs
You should definitely track the number of bugs that your team has to resolve within 2 sprints of releasing a feature. This metric helps you to understand the quality of your code better. Higher-quality code should display fewer bugs after feature deployment.
While there are derivative and more evolved metrics like Defect Density, Mean Time to Detect (MTtD), Mean Time to Resolve (MTrR) and Code coverage, those onces makes sense after you’ve taken stock of and address the prime metric “ No: of Bugs” first.
If you want a more detailed list, methodology of QA metrics, refer the links given below.
4. What is your “Blocker” – Review to Merge Time (RTMT)
This may look like a zoom-in on “Cycle time” metric we discussed earlier. But, in fact it is very different. In fact, it is an interesting metric suggested by GitLab’s development handbook.
You should measure the time between asking for a pull request (PR) review and merging the PR. Ideally, you want to reduce the time a feature spends in the review state (or pending review state). A high RTMT prevents developers from progressing while they wait for feedback and encourages context-switching between different issues/features.
Arguably, Context-Switching is the highest productivity killer and should be avoided as much as possible.
So, why would you measure all these engineering productivity metrics?
Why Is Measuring Engineering Productivity Important?
When you’re a “fast-growing startup”, it’s important to keep an eye on engineering productivity. It happens that these startups favour growth through feature delivery at the cost of effectively scaling the engineering team and ensuring the team’s efficiency.
I hear your question.
But, why does my CEO/VP/MD not understand?
Answer is simple
Assume you have to manage multiple VP’s expectations and outcomes (Sales, Marketing, Support etc), Company’s OKRs, and investors (or) board, will you have more time to dedicate to Engineering Productivity?
In these cases, technical debt can quickly grow, which will slowly kill your team’s productivity. Technical debt can have many negative consequences:
- More bugs for your team to fix
- Lower code quality—not only bugs but also worse code design
- Harder to debug code
- Scalability issues
- A decline in overall happiness and job satisfaction
To avoid all of these scenarios, you should measure the engineering team’s efficiency and avoid technical debt buildup. Avoiding these problems before they occur is an excellent Occam’s razor. But addressing them head-on will have a significant impact on your organisation, both materially and culturally.
In addition to preventing your team’s productivity from going down, the engineering productivity approach allows you to experiment with various approaches to try and improve throughput & efficiency.
So, the goal is to improve the engineering process itself. For example, introducing new tools or applying new techniques. Next, you can measure the impact of these changes on your team’s productivity.
In the next part, I will write down on how can measurement improve engineering productivity, Stay Tuned!
References:
- Survivorship Bias.
- Cycle Time
- Release Frequency
- Detailed QA Metrics to ponder (in addition to No: of bugs)
- Review to Merge Time
- Context Switching